build a site

In this portfolio section, you'll find a diverse selection of assignments and projects completed during my Erasmus Mundus Copernicus Masters in Digital Earth program. These projects offer a glimpse into the skills and knowledge acquired in earth observation, geoinformatics, and artificial intelligence, and demonstrate my ability to apply these to solve problems of varying complexity.

Mobirise

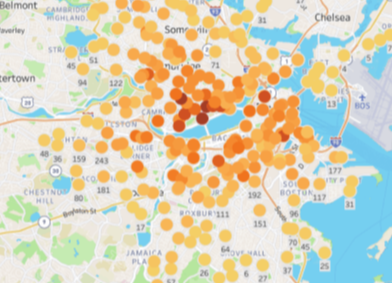
Boston Biking Dashboard

Tableau dashboard visualizing the trip durations in minutes, average trip duration by users, and distribution by station of the Boston bikes dataset. Learn More..


Mobirise

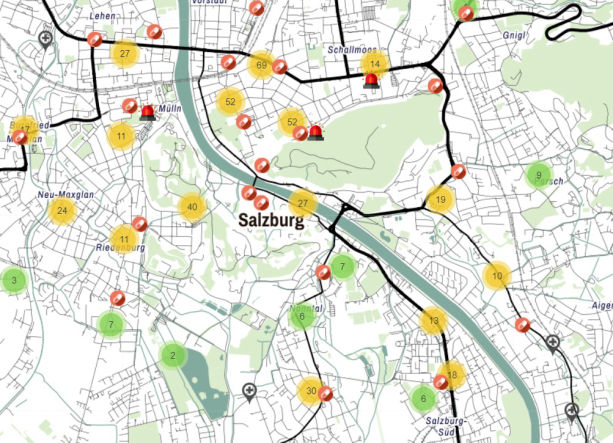
Leaflet Web Application

Interactive web application developed using the Leaflet JavaScript web mapping library to show the distribution of health facilities in the City of Salzburg. Learn More..


Mobirise

Car accidents in Paris 

Observable notebook that extracts an analysis problem from dataset on accidents in Ile de France and proposes visualizations to answer it. Learn more..

Mobirise

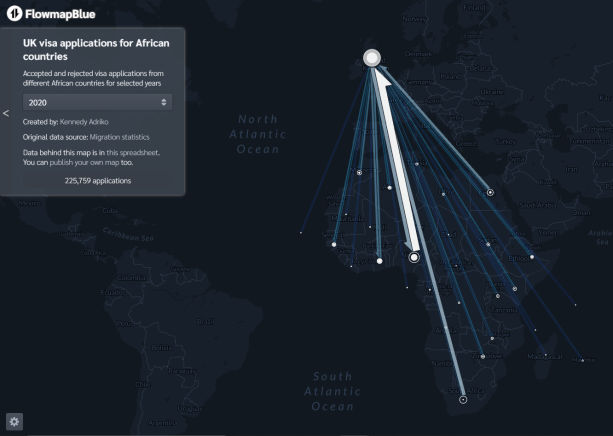
Flow Map Visualization

Flow map visualization created using flowmap.blue and the UK visa applications statistics for Africa from 2005 to 2021 accessed from the UK migration statistics database. Learn more..

Mobirise

Distance Analysis 

Analysis of kindergartens and motorways proximity using 'Find existing locations','Buffer', 'Create Drive time areas' distance analysis tools. Learn more..


Mobirise

UAV Photogrammetry

Agisoft cloud visualization showing orthomosaic, DEM derived from drone image processing in the 'Advanced Remote Sensing' course. Learn more..


Mobirise

Spatial Interpolation 

Exploration of spatial interpolation techniques i.e. IDW using temperature data for Belarus. Learn more..

Mobirise

Solar energy Analysis

ArcGIS Story map that shows the results of solar radiation modelling, solar energy estimation for Itzling, Salzburg. Learn more..

Mobirise

Network Analysis 

Analysis of walking time zones, walking and driving times and routes for selected museums and glass waste containers in the city of Salzburg. Learn more..


Mobirise

Visual Impact Analysis

Visual impact assessment scenario for a planned high rise building in Salzburg with possible height of 50m and 100m considered.  Learn More..


Mobirise

WebGIS Backend Database

'Spatial Databases' course project to create a database for a city festival (e.g., of your hometown or create a fictional one) as a backend for a Web GIS. Learn more..

Mobirise

Semantic EO Data Cube 

Digital earth Big earth data concepts assignment using Sen2Cube.at, the first operational semantic EO data cube, allowing you to produce information from satellite imagery on a higher semantic level. Learn more..

© Copyright 2023- All Rights Reserved